Reports
All your data in interactive dashboards. Define views and filters, measure team performance and plan the best strategy.
Your organization’s numbers. View project and task reports in interactive charts by year, status, work area, priority and owner—including Gantt.
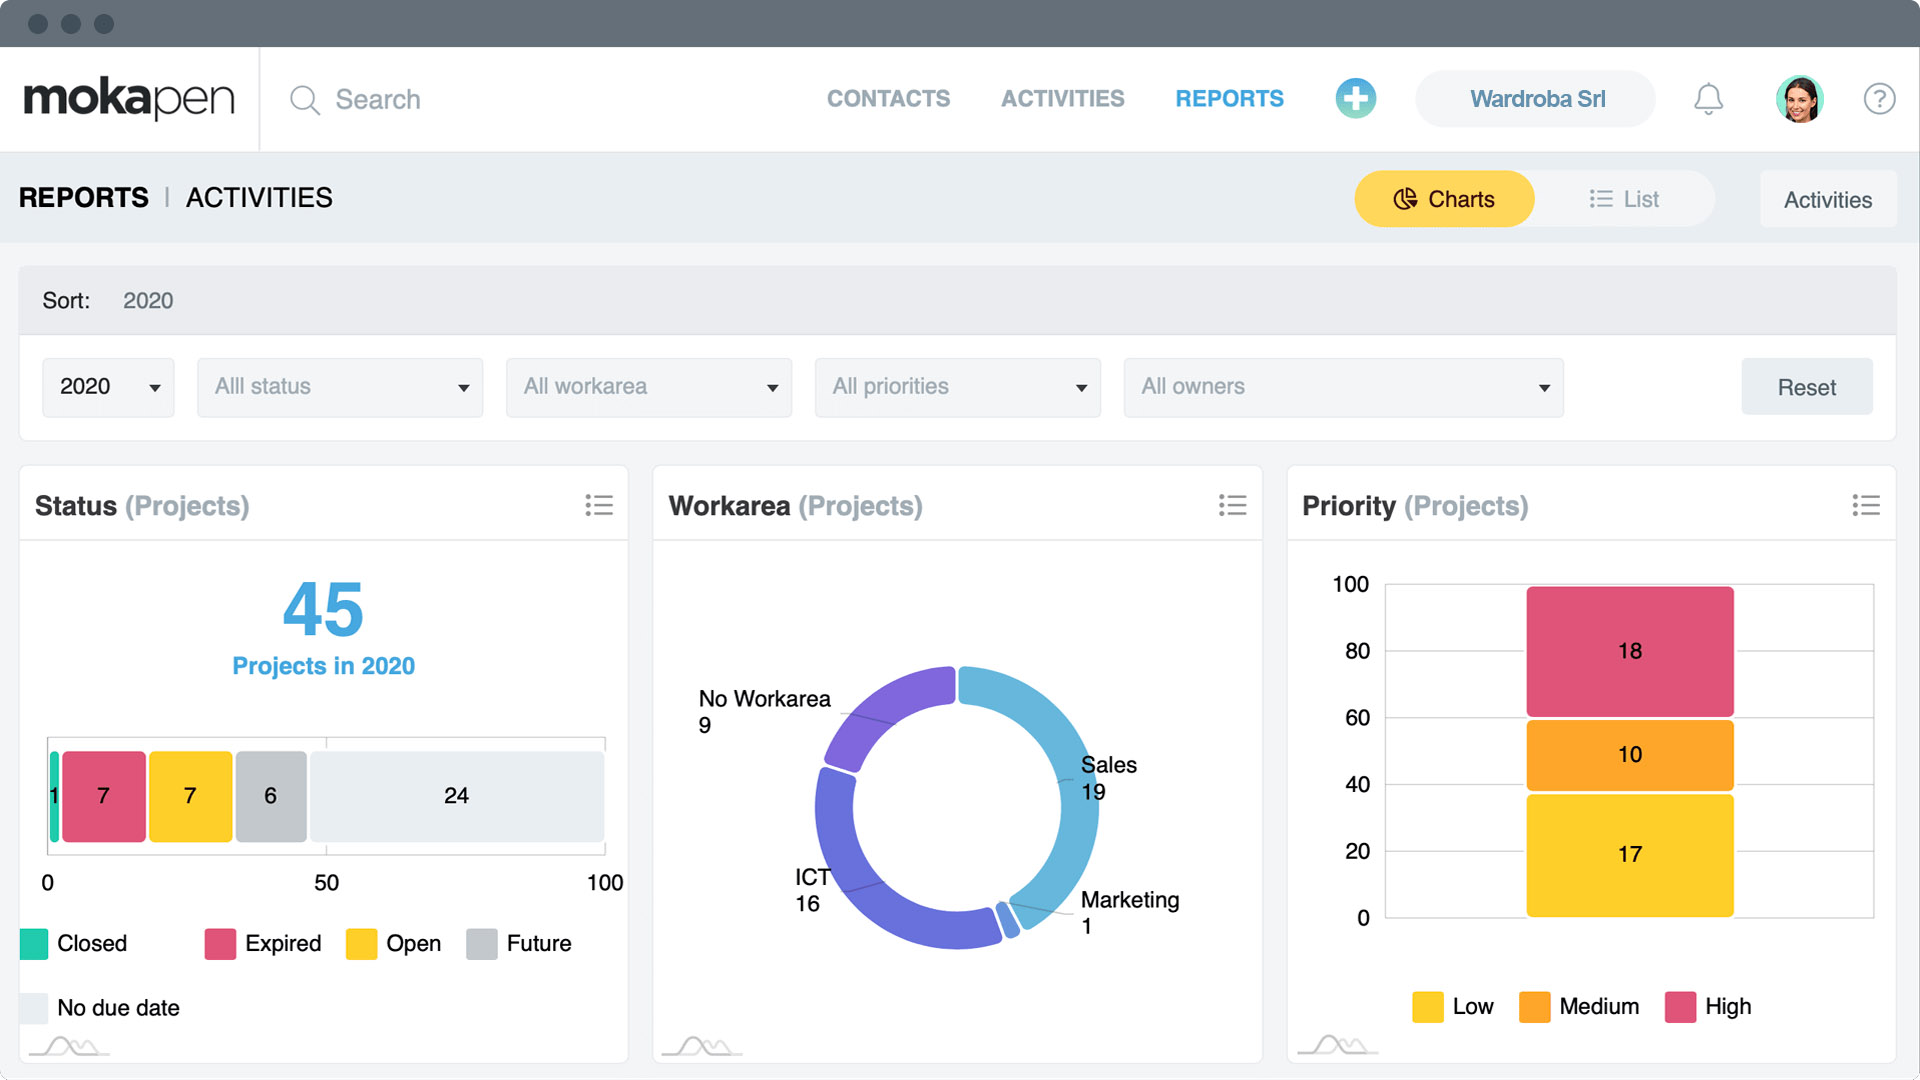
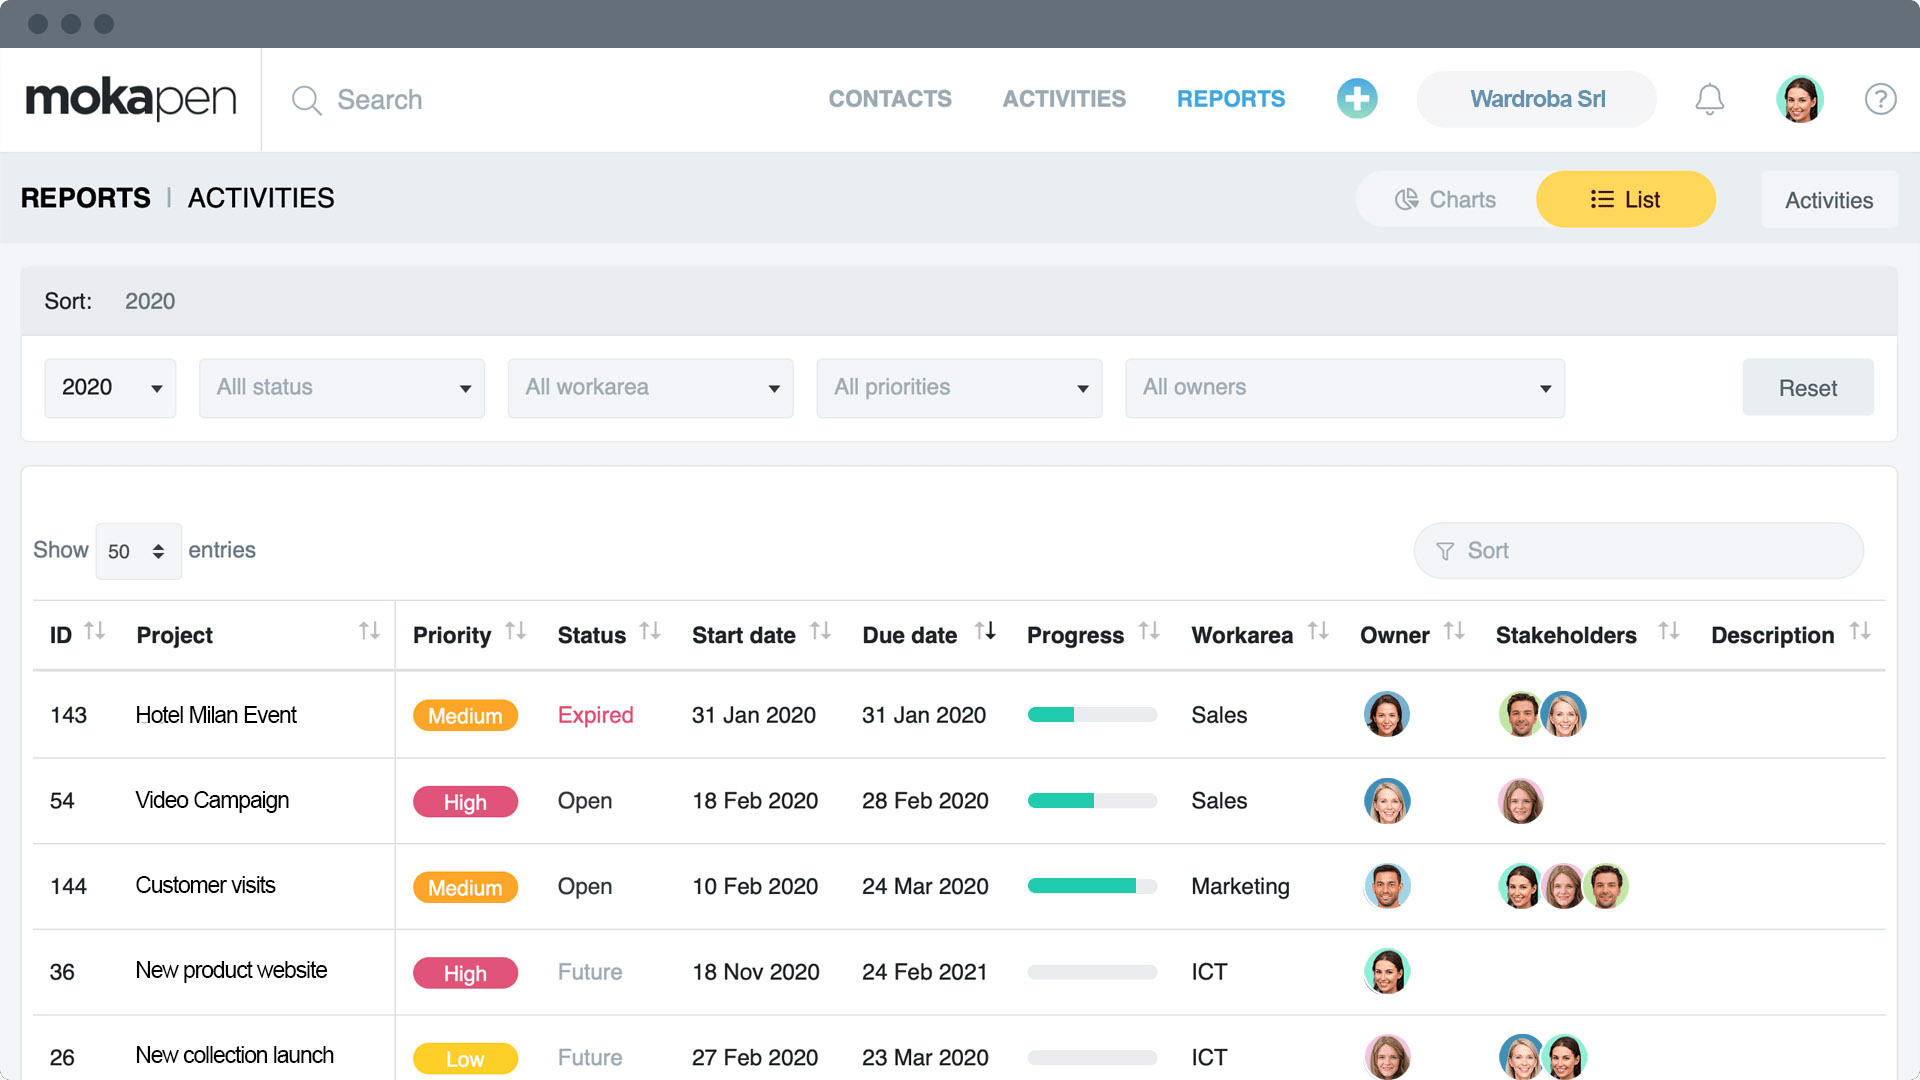
From chart to detail. Sort in lists, filter and find projects and tasks fast for every review meeting.
Together with Reports
Need help?

is handmade








Secure payments with
|
Mokapen Srl - Startup Innovativa - Via Francesco Arese 12, 20159, Milano (Italy) - C.F./P.IVA 12021740969 - R.E.A. 2635193 - info@mokapen.com
© 2026 Mokapen. All rights reserved.