Rapporter
All din data i interaktiva instrumentpaneler. Define views and filters for your reports, measure your team's performance and plan the best strategy.
The numbers of your organization. Visa projekt- och uppgiftsrapporter i interaktiva grafer efter år, status, arbetsområde, prioritet och chef. Hey, there's a Gantt chart too!
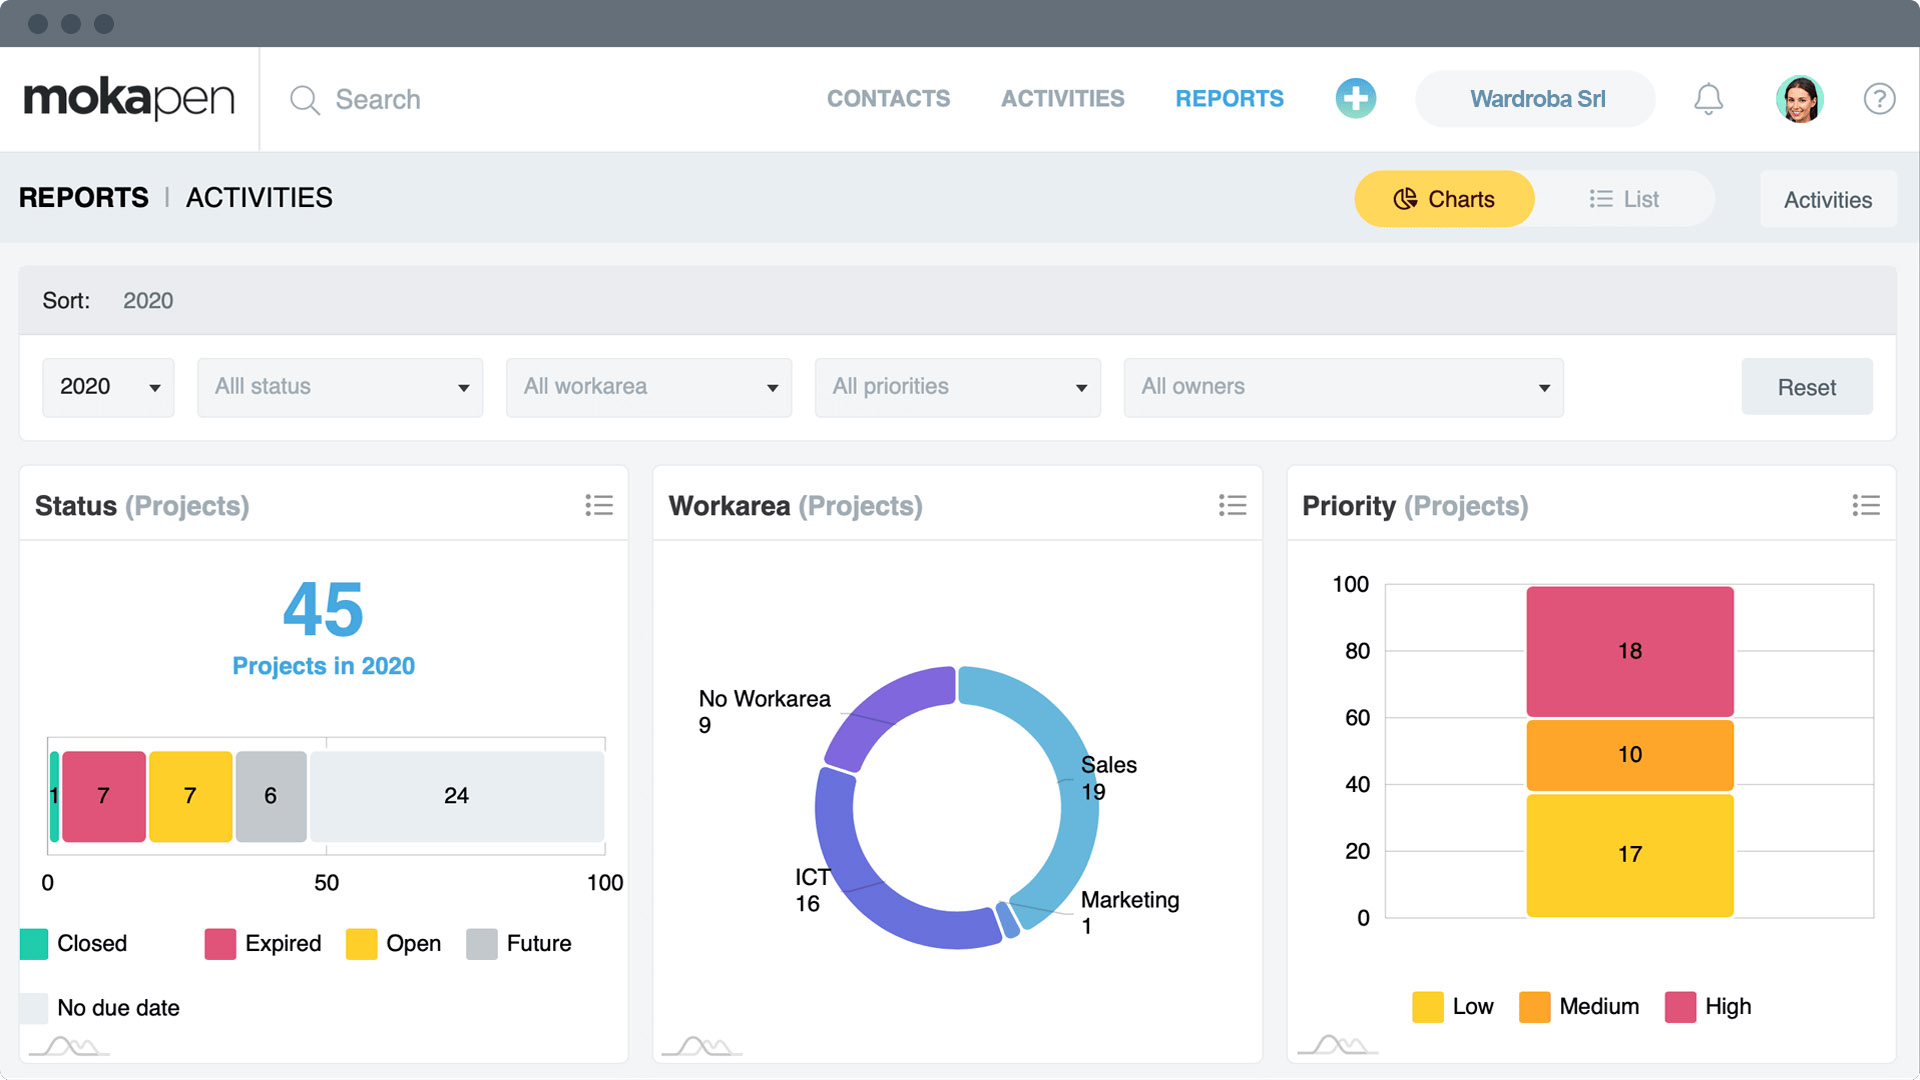
Från grafik till detalj. Sortera genom listor, filtrera och hitta snabbt projekt och uppgifter. Du kommer att ha den strategiska analysen för varje typ av framstegsmöte.
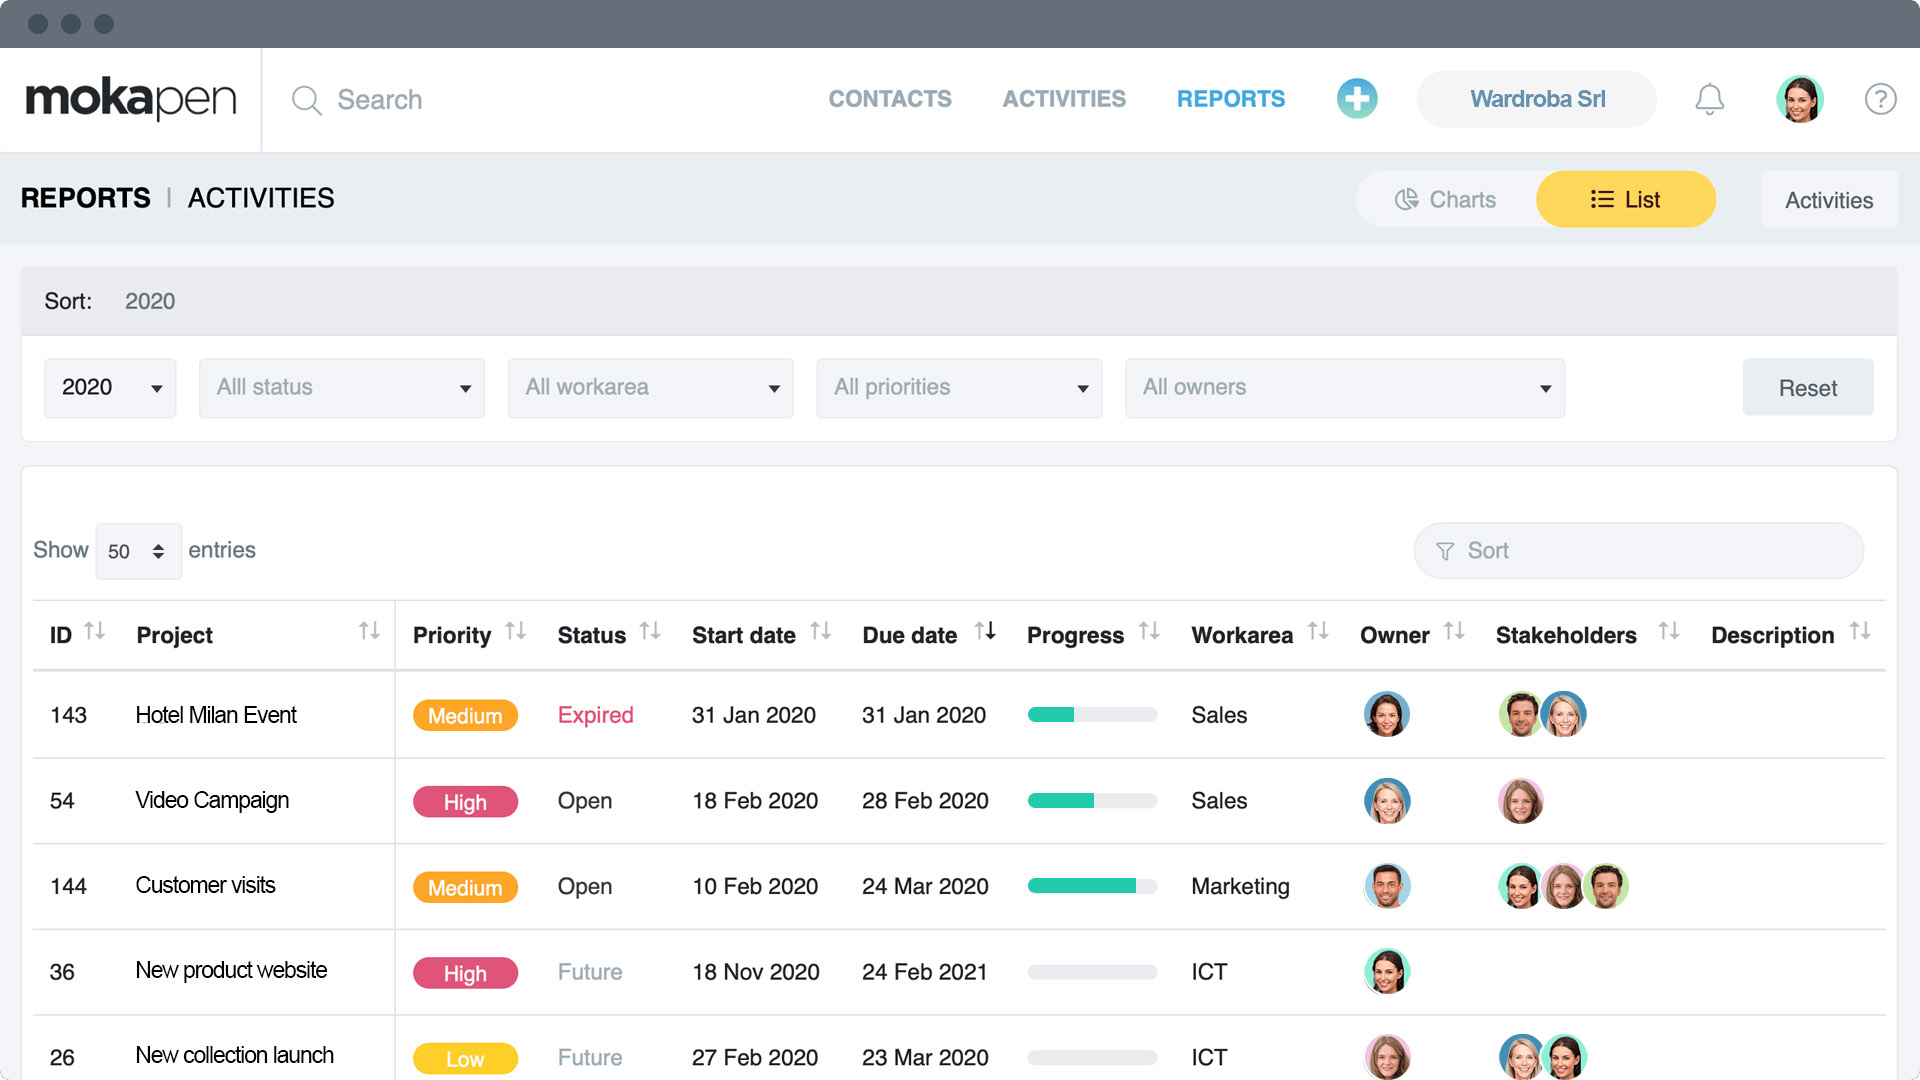
One dashboard for the modules you use. The charts start from data already in the CRM, not from an export.
Ange (Projekt)
Stängd
25
Öppna
17
Utgått
3
Arbetsområde (Projekt)
Försäljning
19
Software
16
Marknadsföring
1
Prioritet (Projekt)
Låg
17
Genomsnitt
10
Hög
18
Together with Rapporter
Behöver du hjälp?

den är handgjord





Säkra betalningar med
|
Mokapen Srl - Via Francesco Arese 12, 20159, Milano (Italien) - skattenummer/moms 12021740969 - R.E.A. 2635193 - info@mokapen.com
© 2026 Mokapen. Alla rättigheter reserverade.