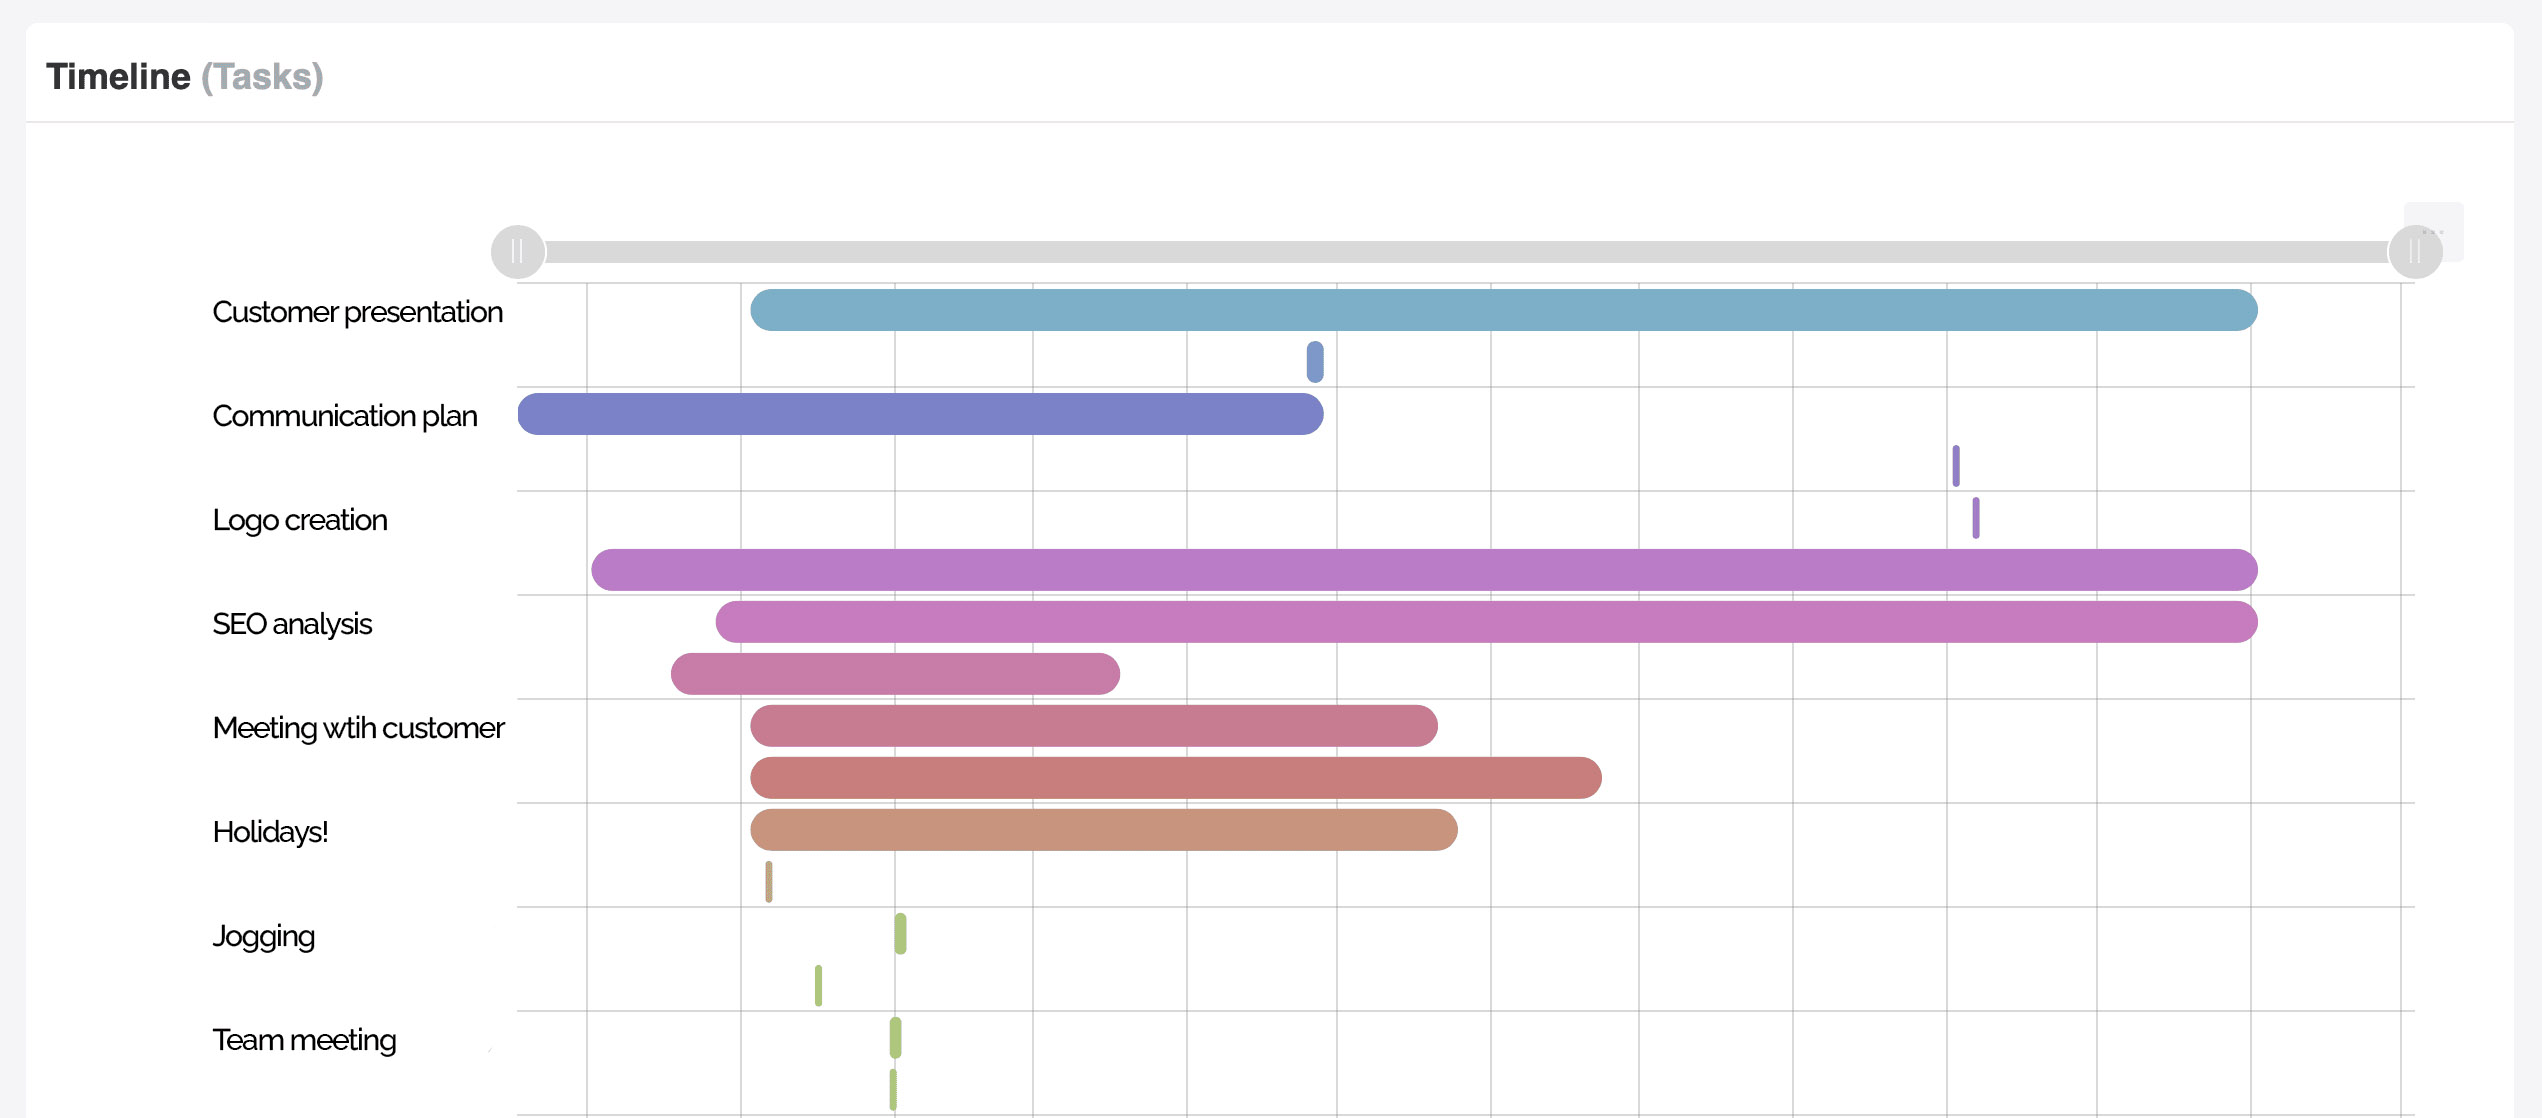
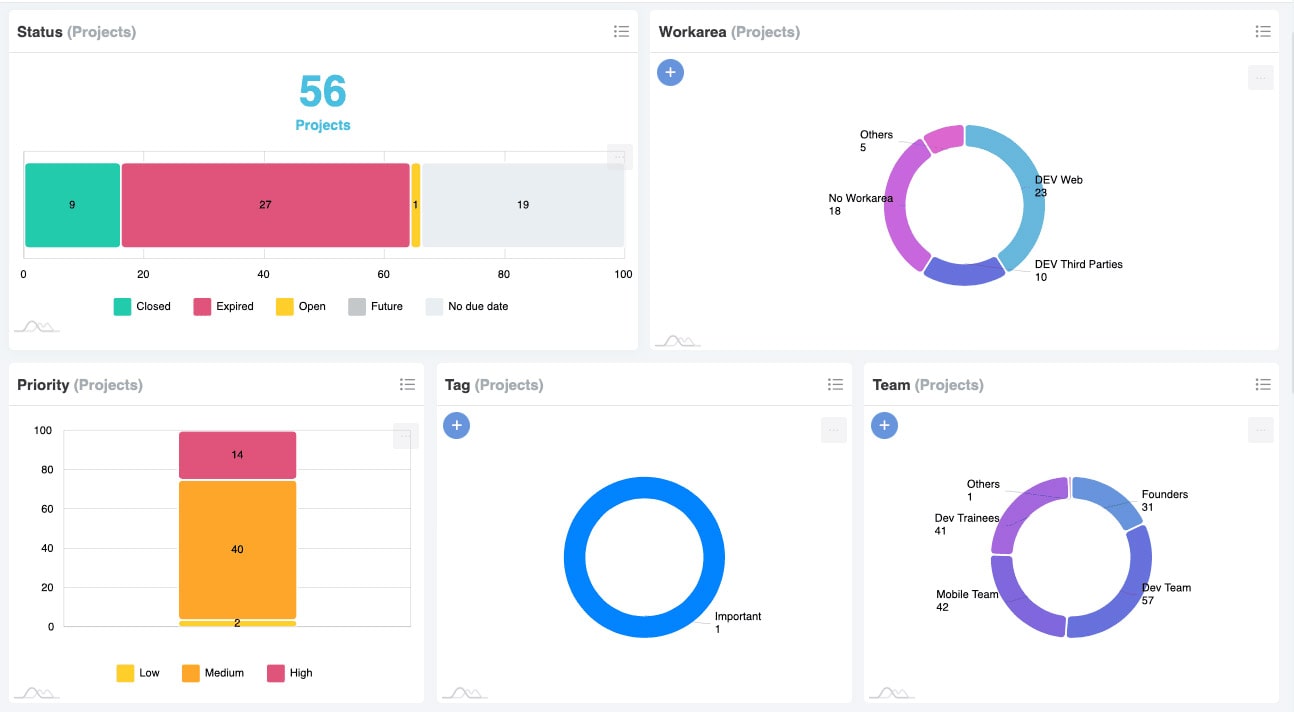
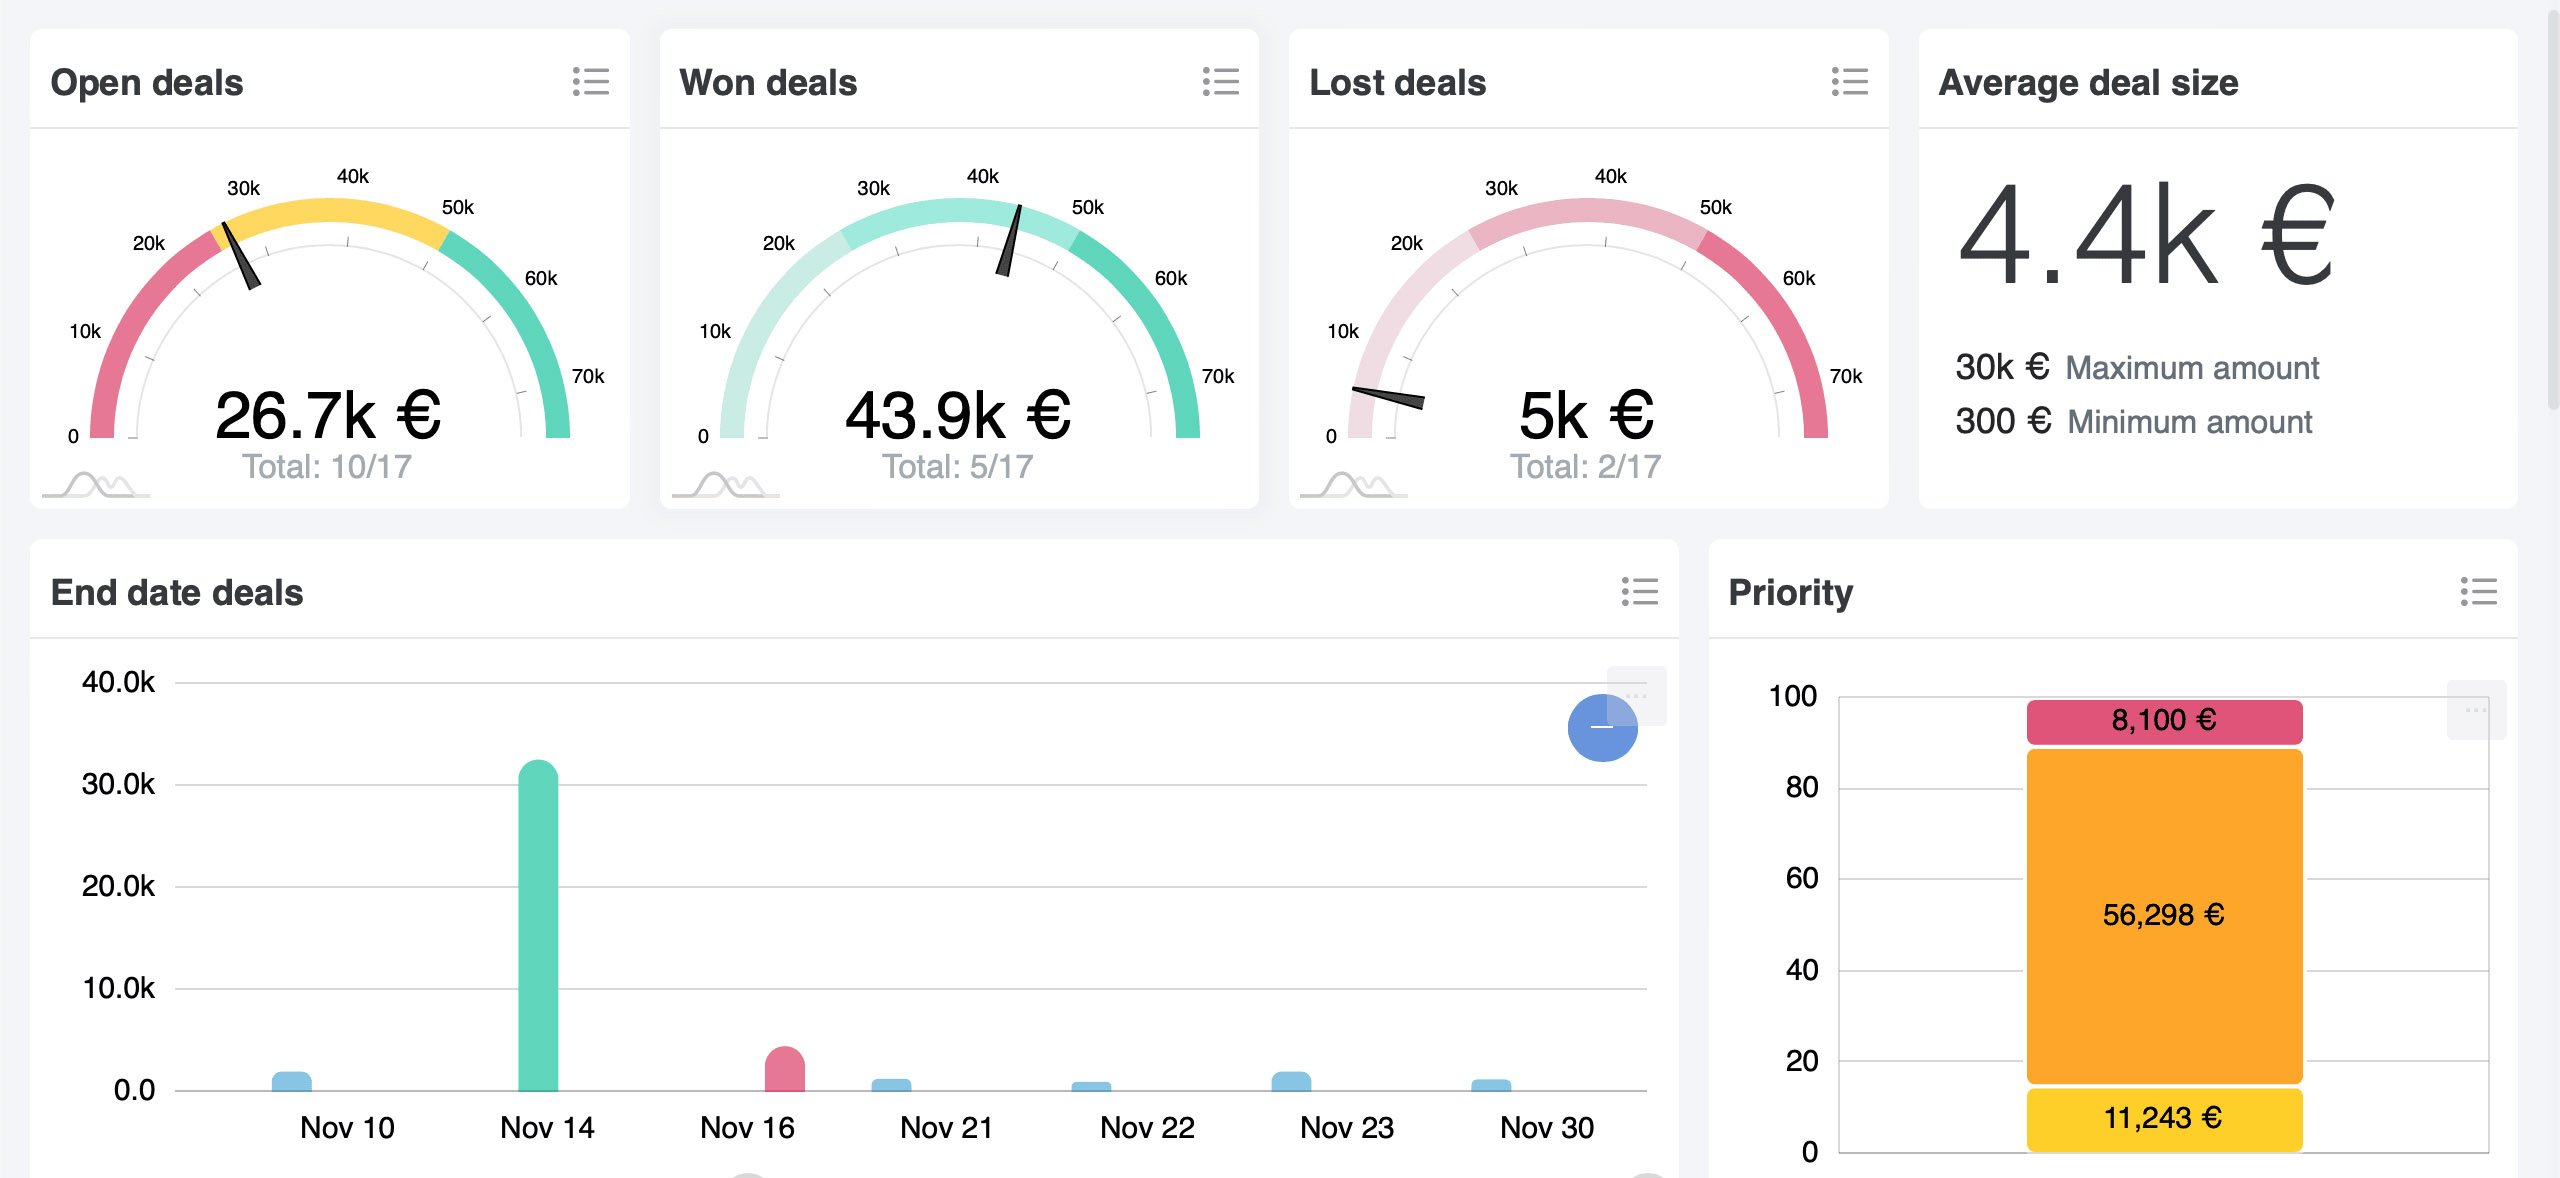
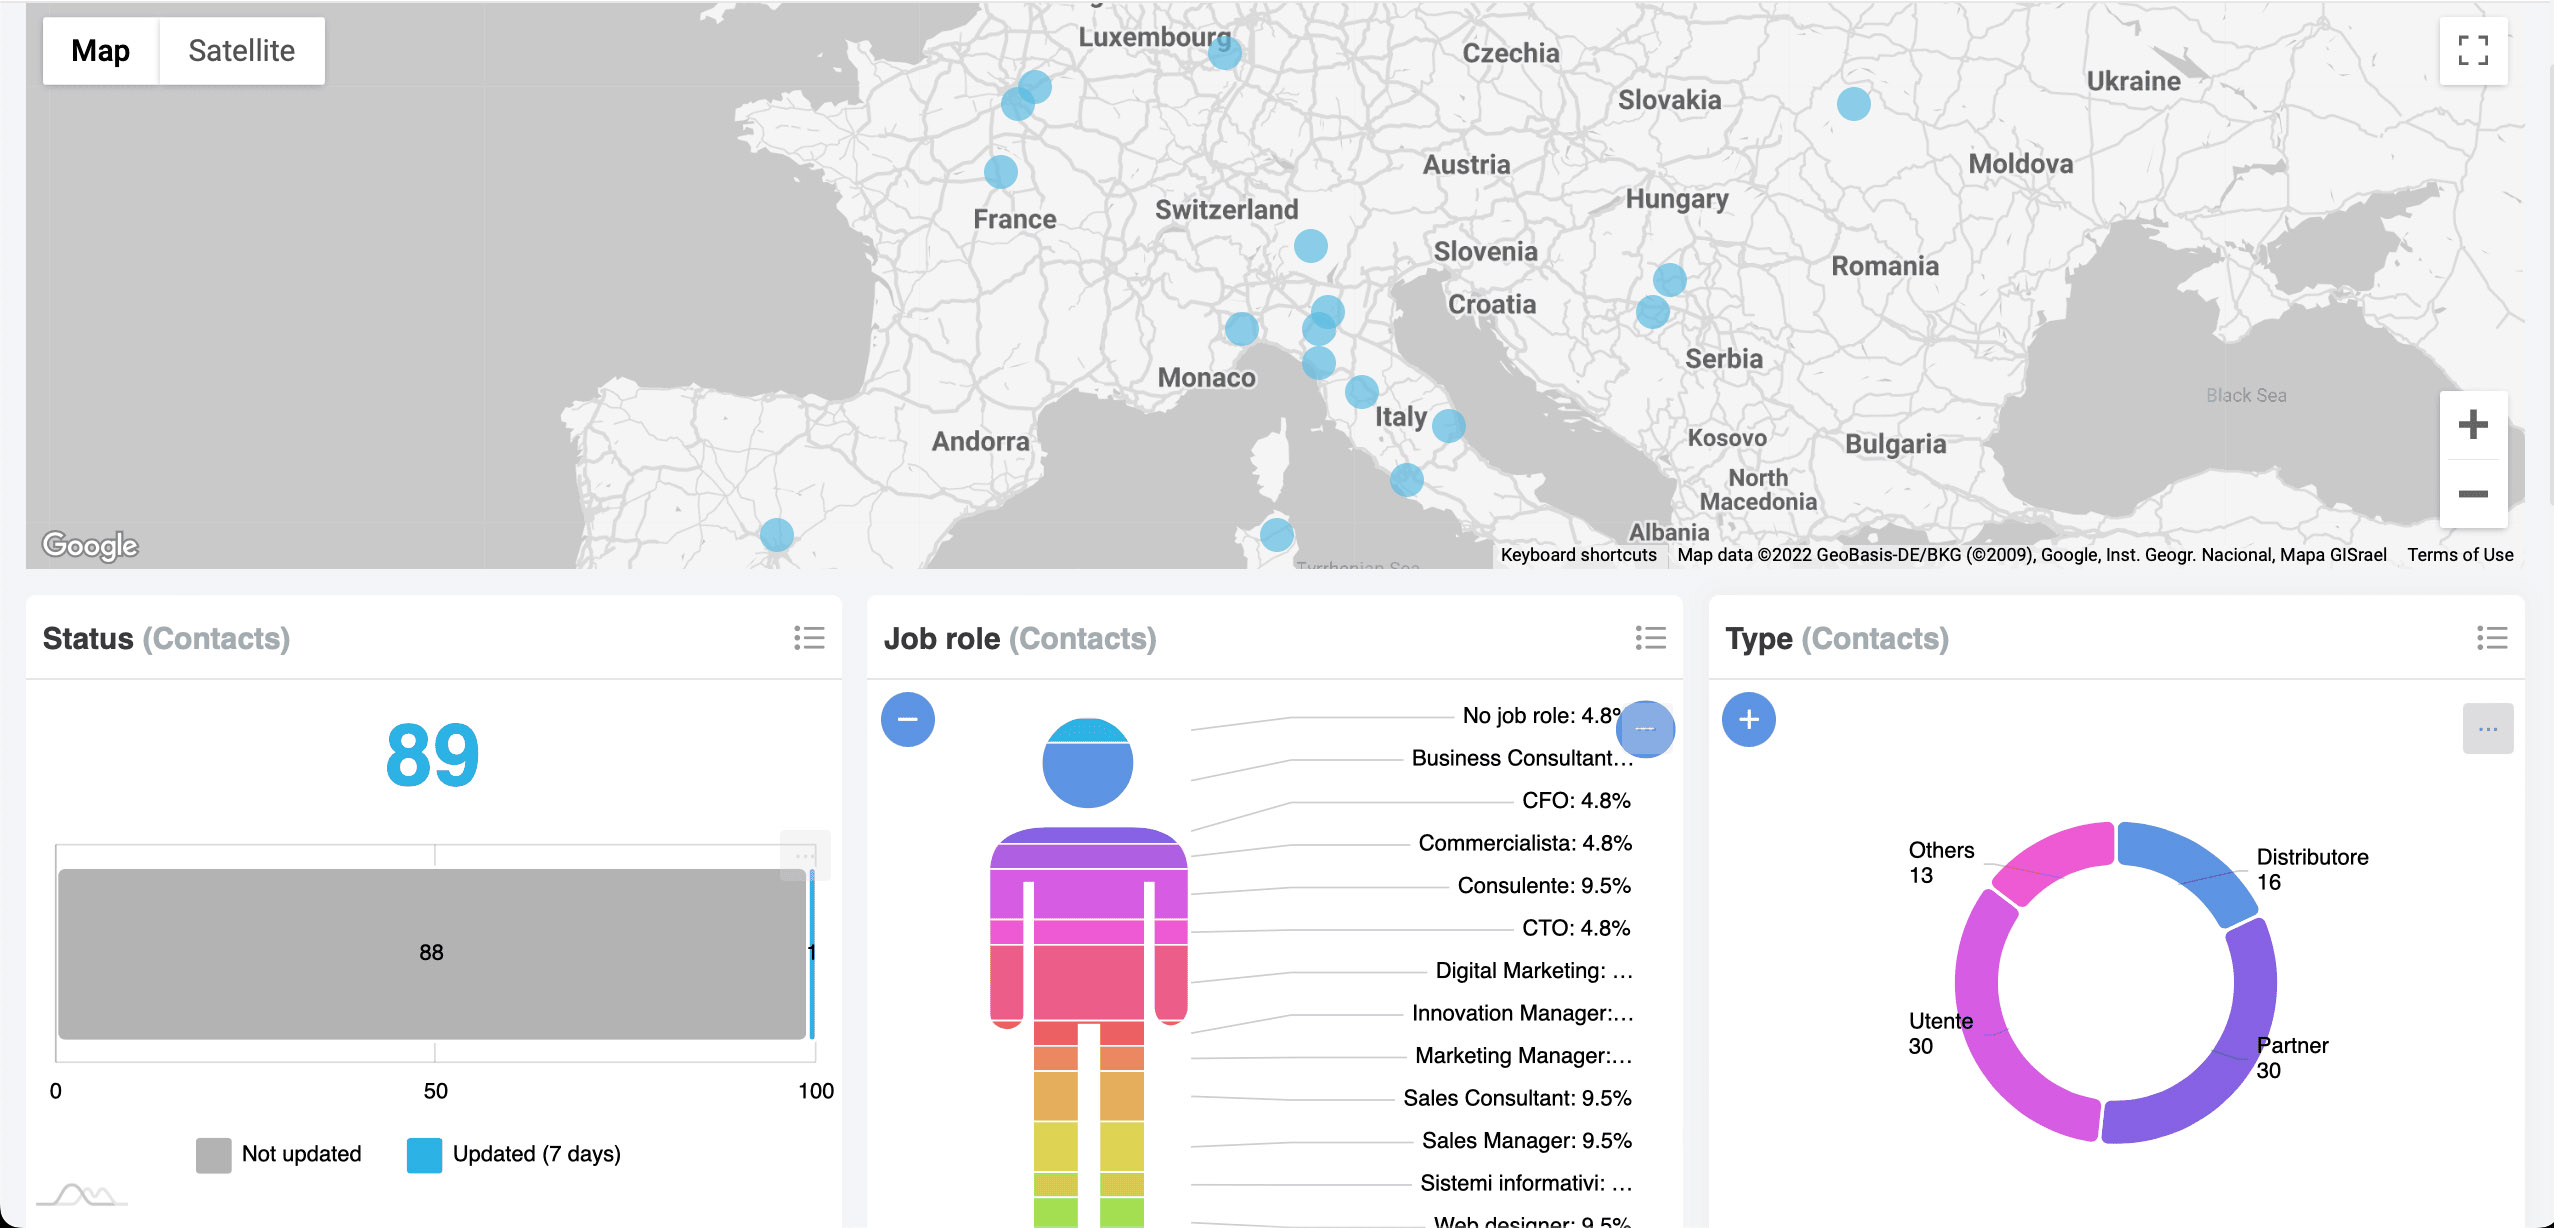
Monitor your team's tasks in an interactive dashboard.
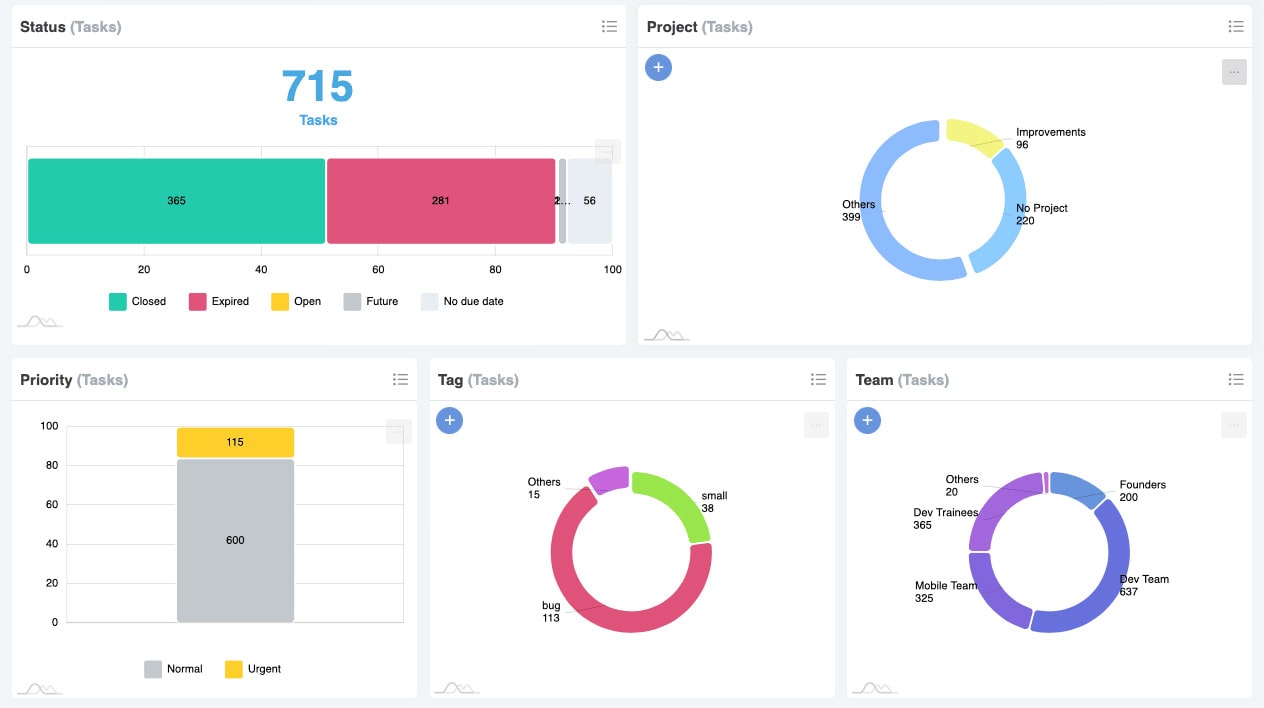
View tasks, deadlines and priorities to achieve goals.
Assign leadership to your team and measure performance.
Analyze data in real time, view details, filter according to your needs and download graphs for your presentations.
Interacting with a colored graph is faster than read 10 pages of reports!
