Track your team's sales in an interactive dashboard.
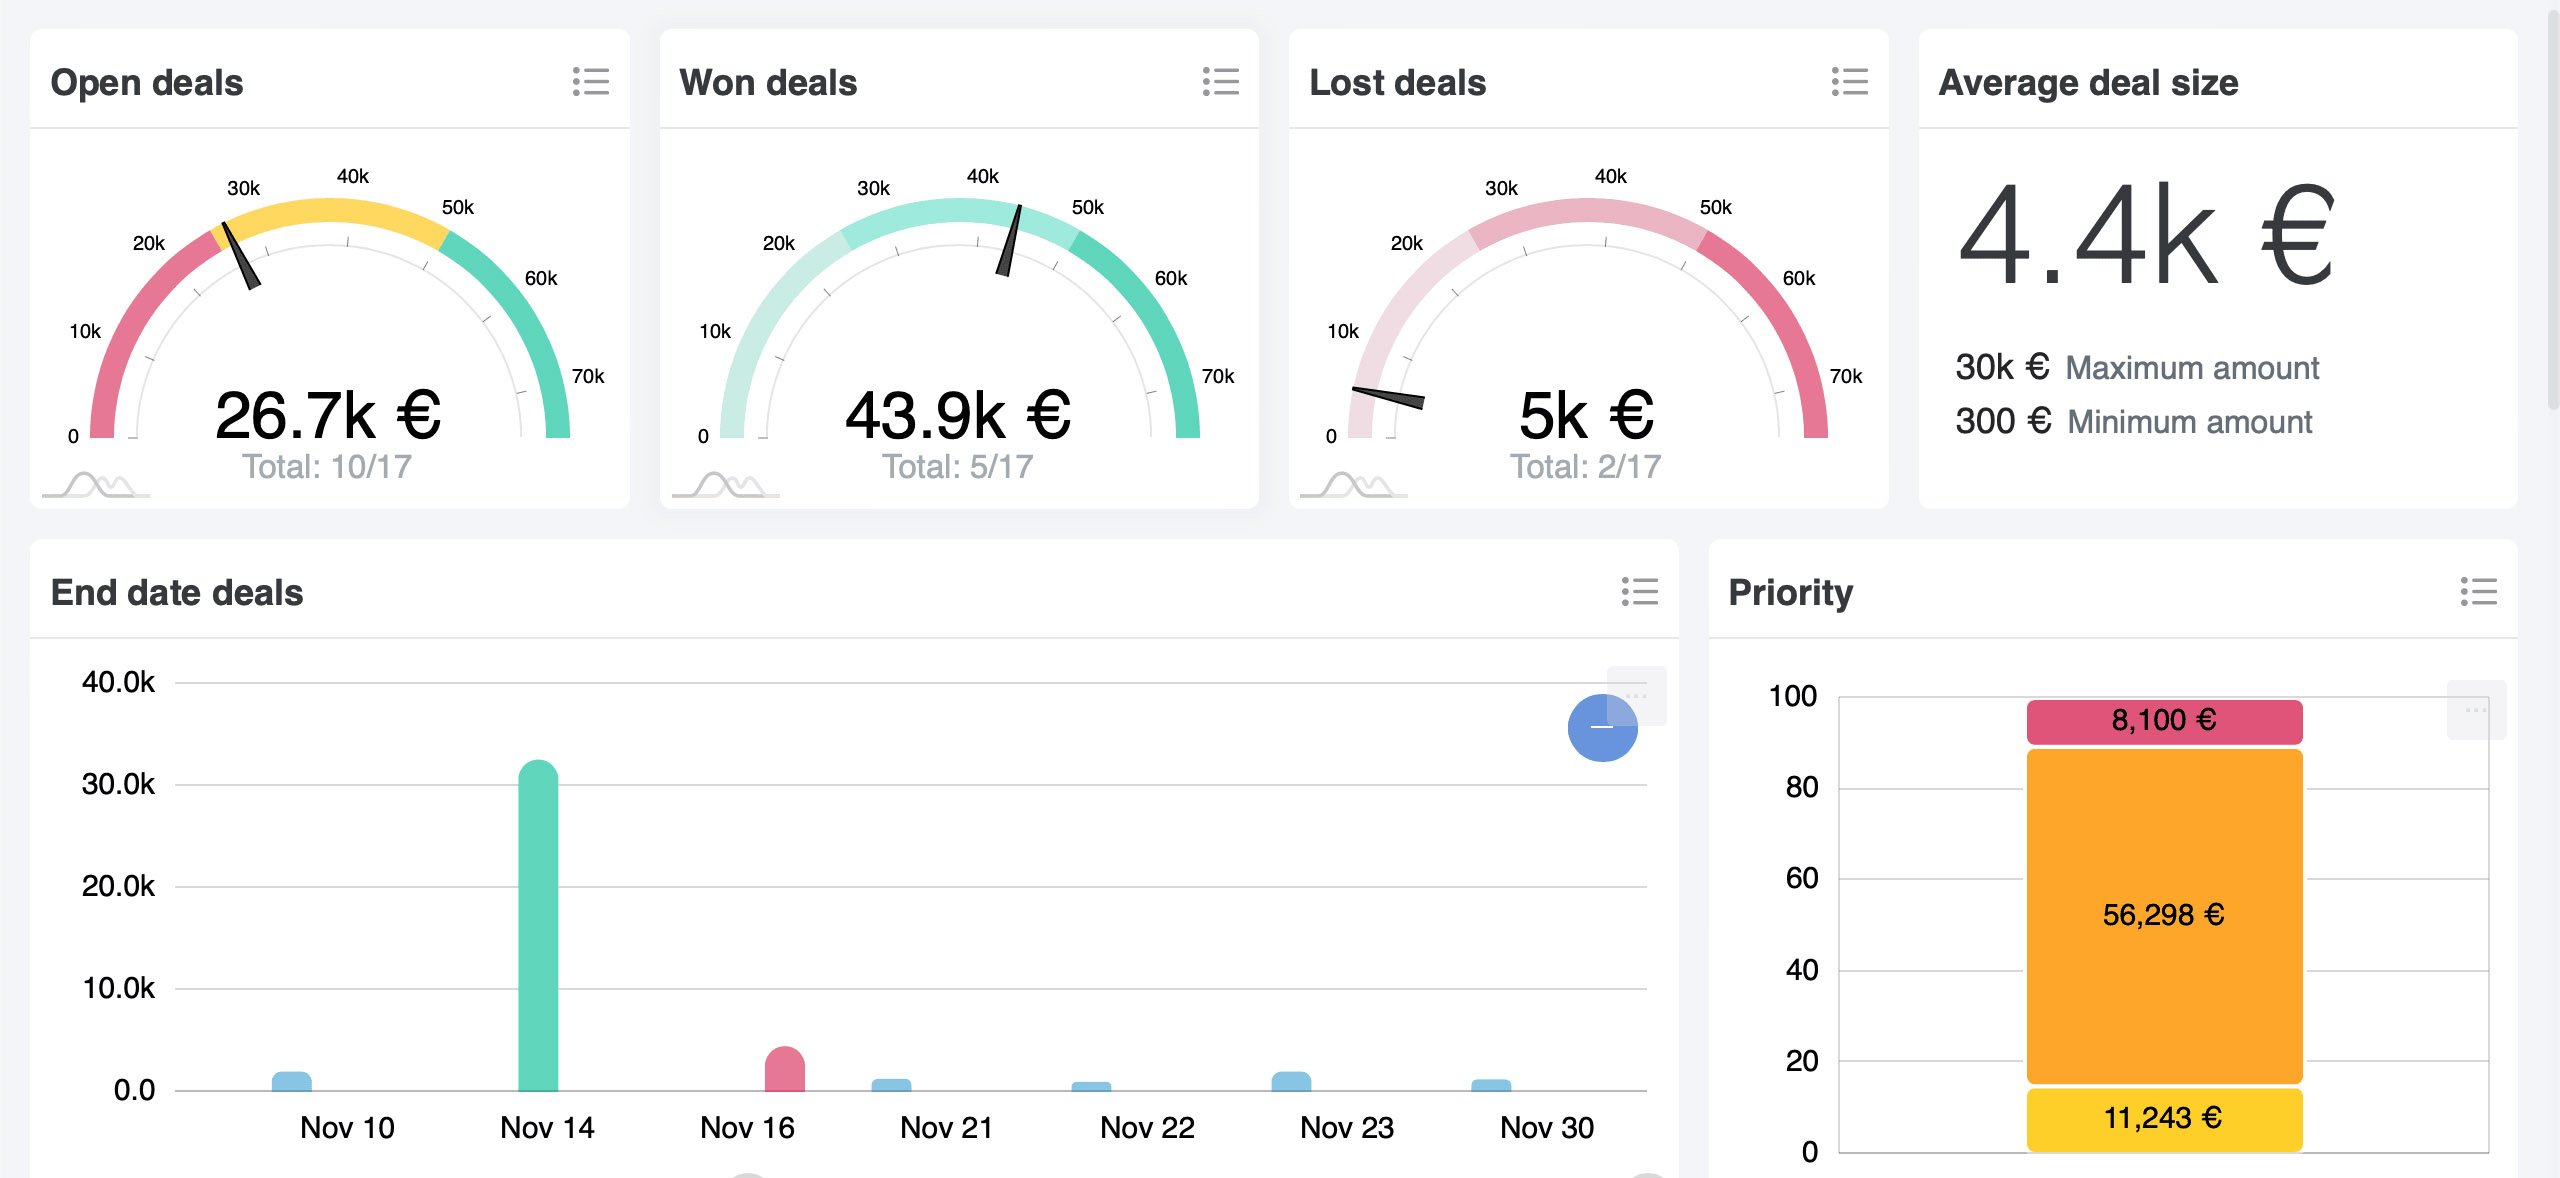
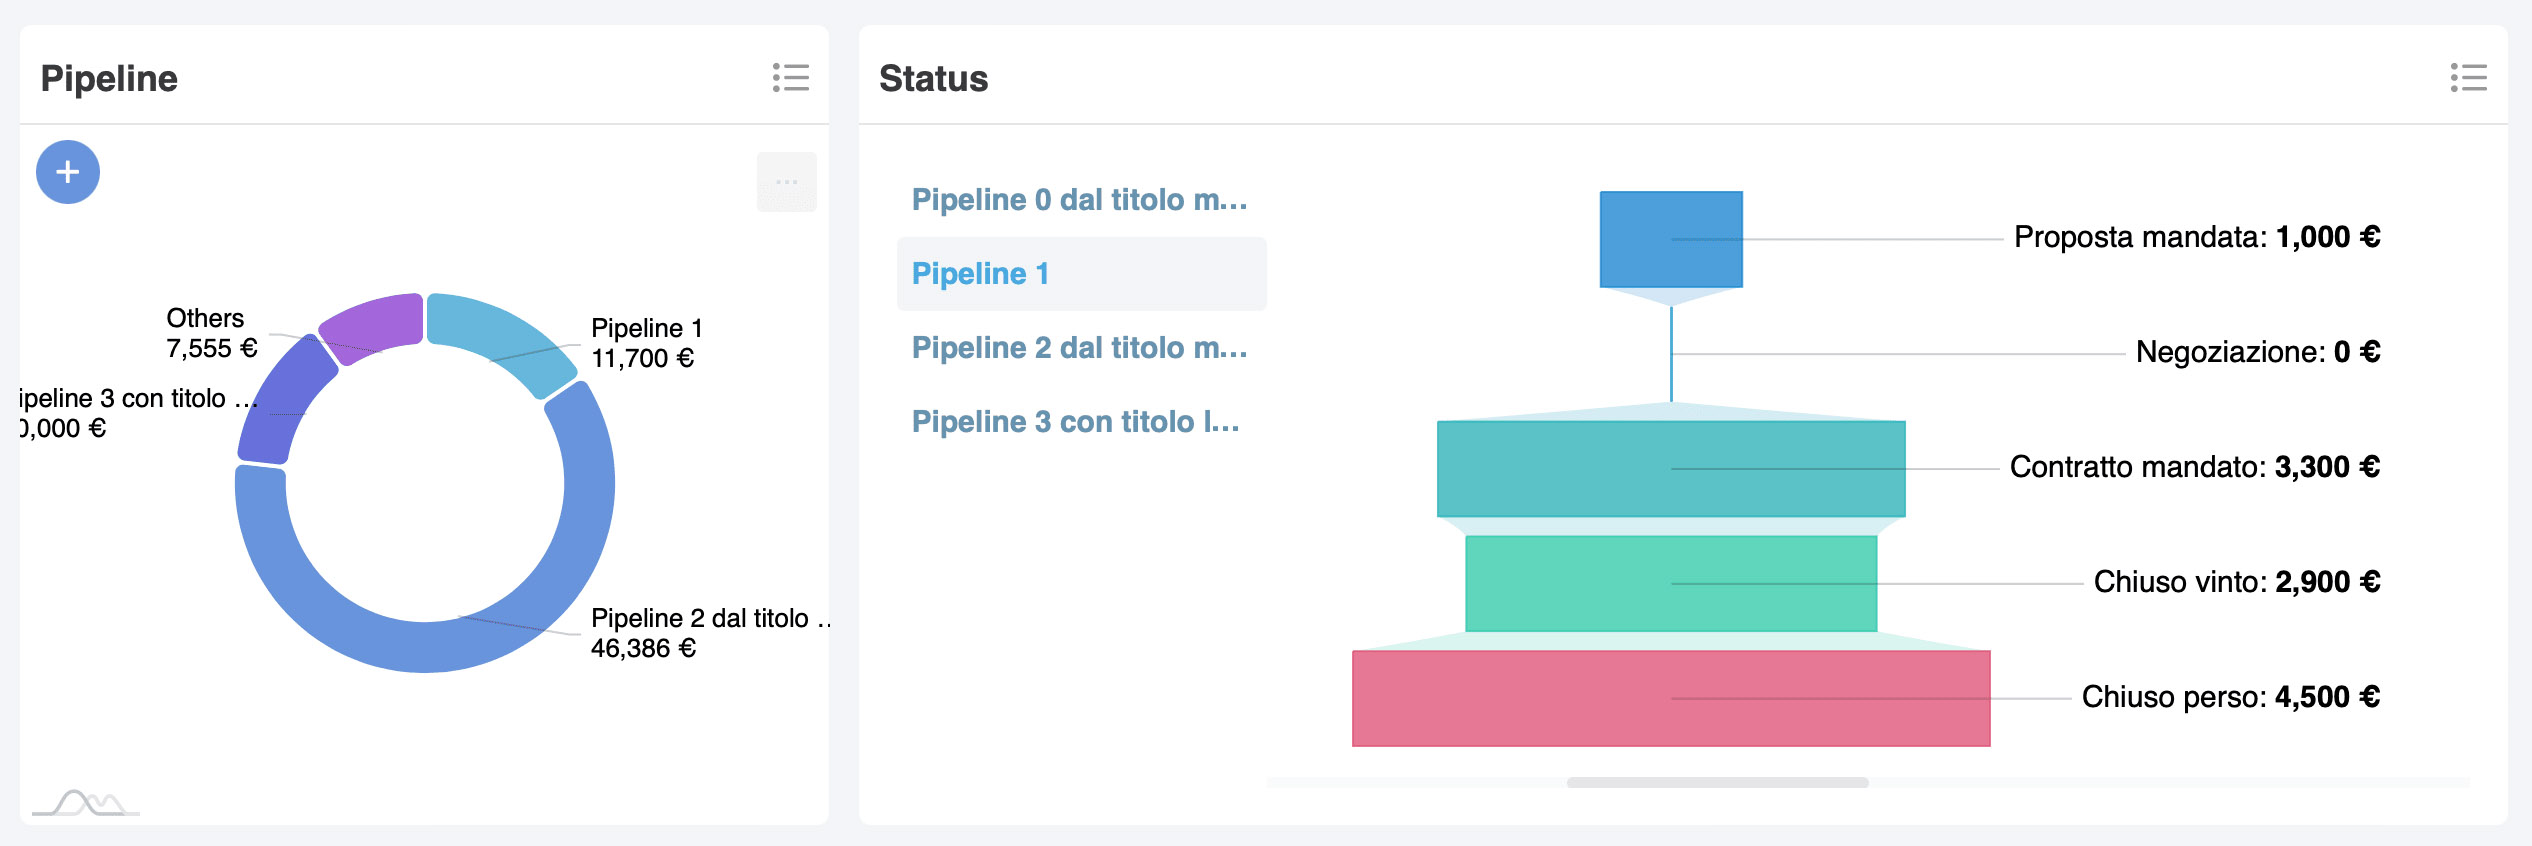
View the performance of the sales pipeline and the various stages of progress in the deals and sales funnel.
The sales team will always have the strategy and objectives under control!
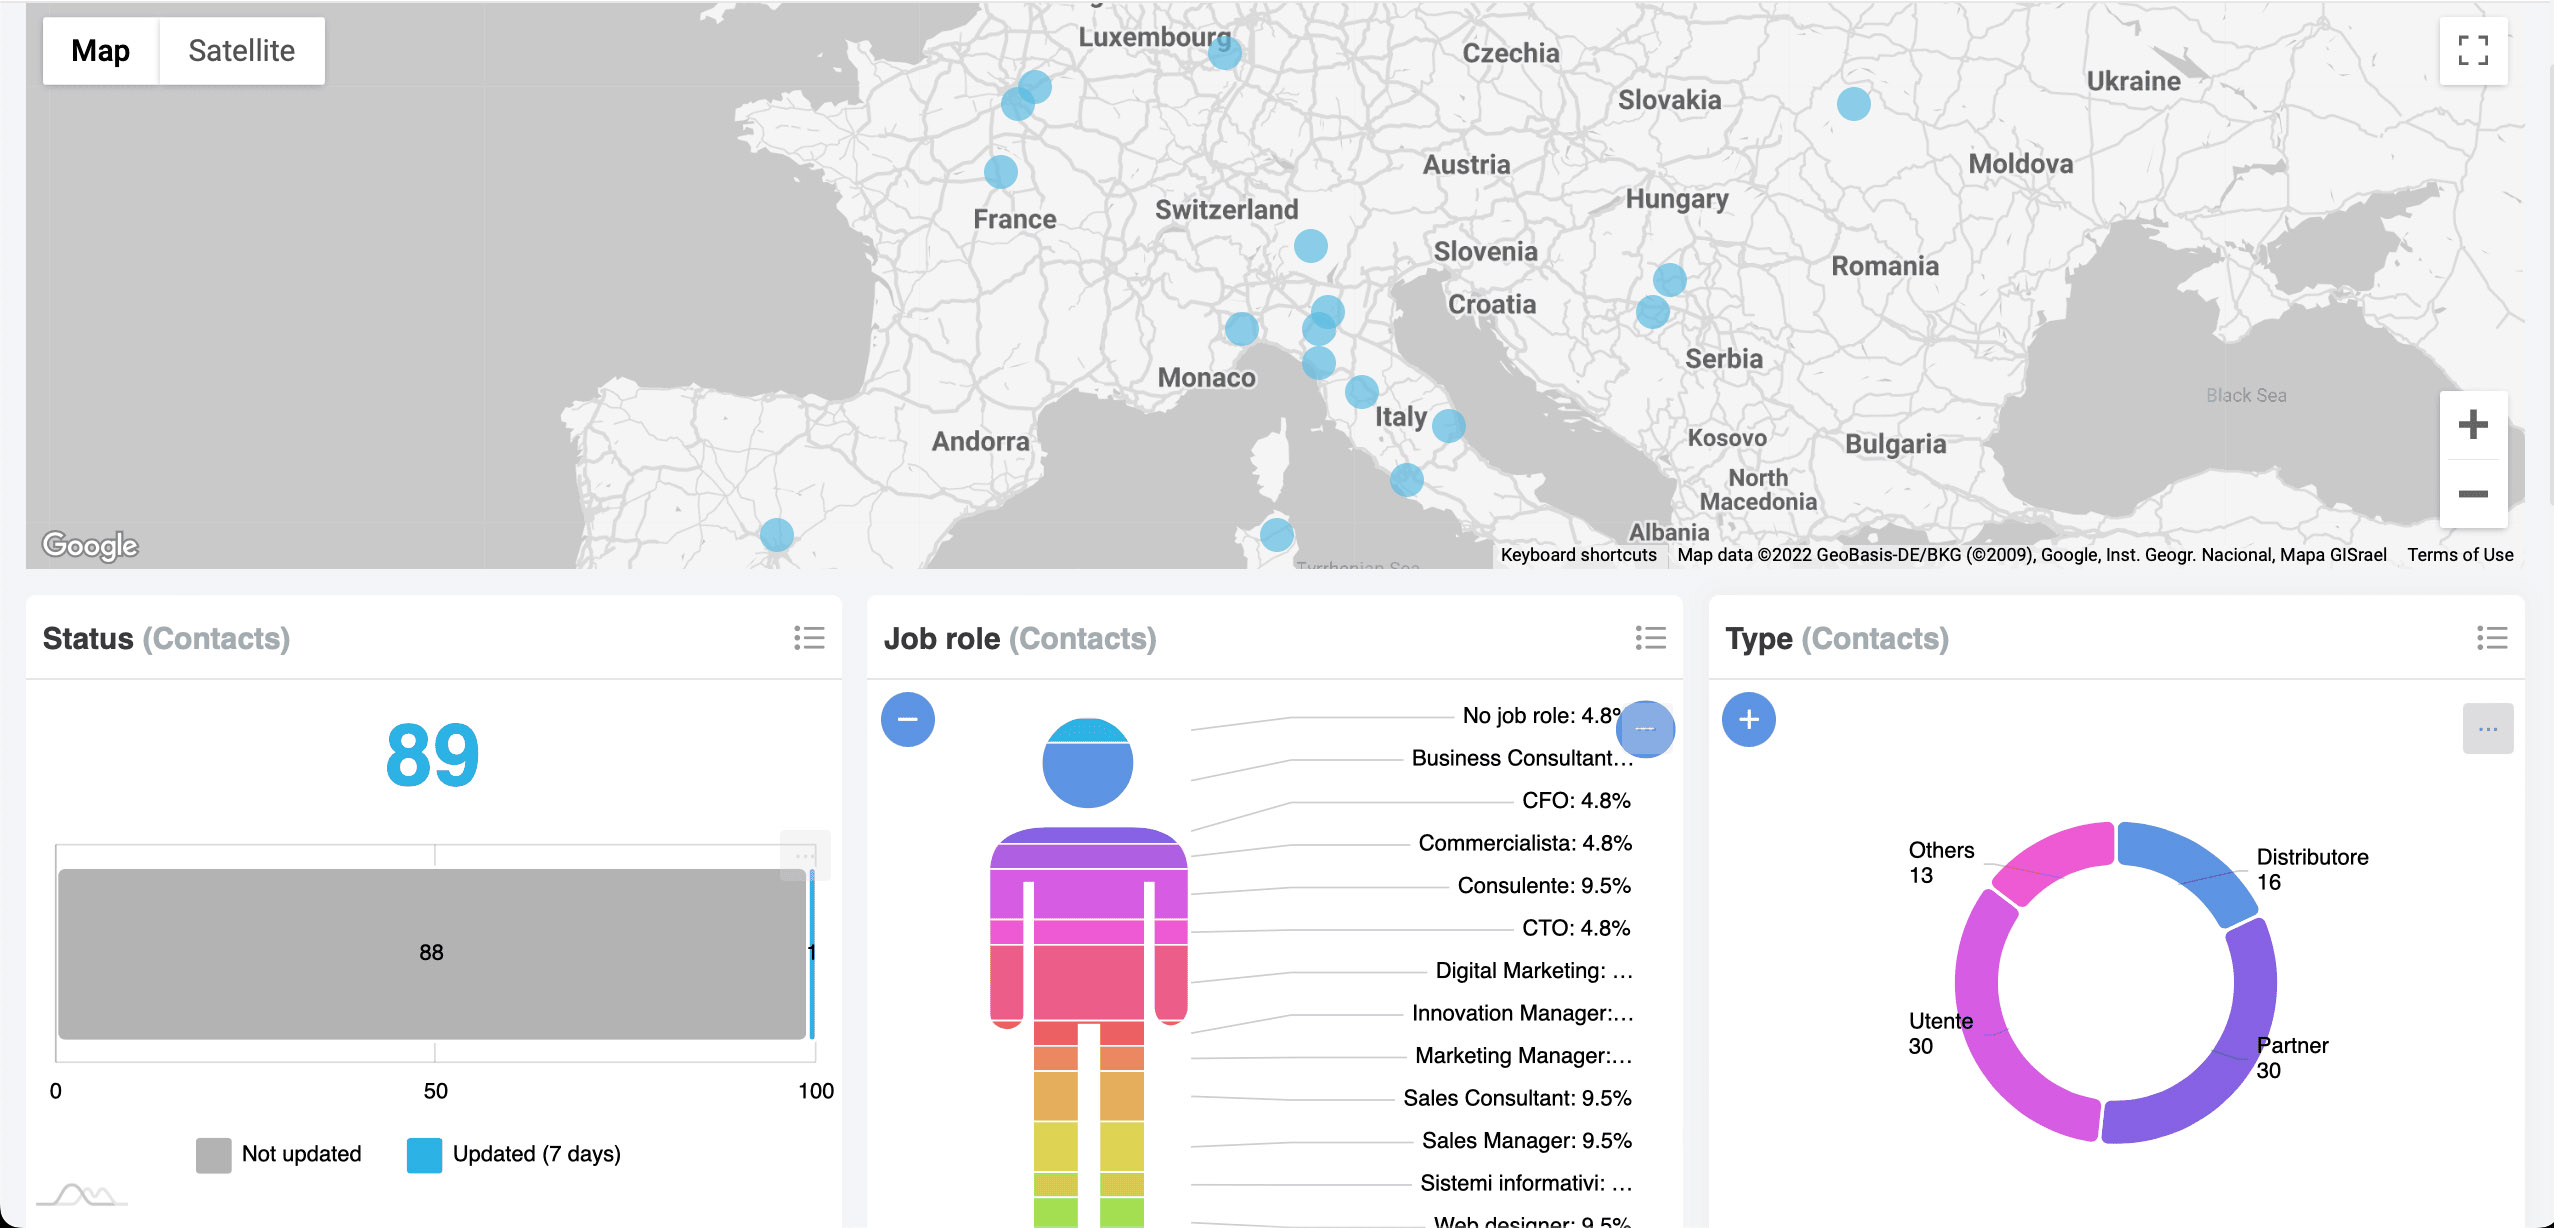
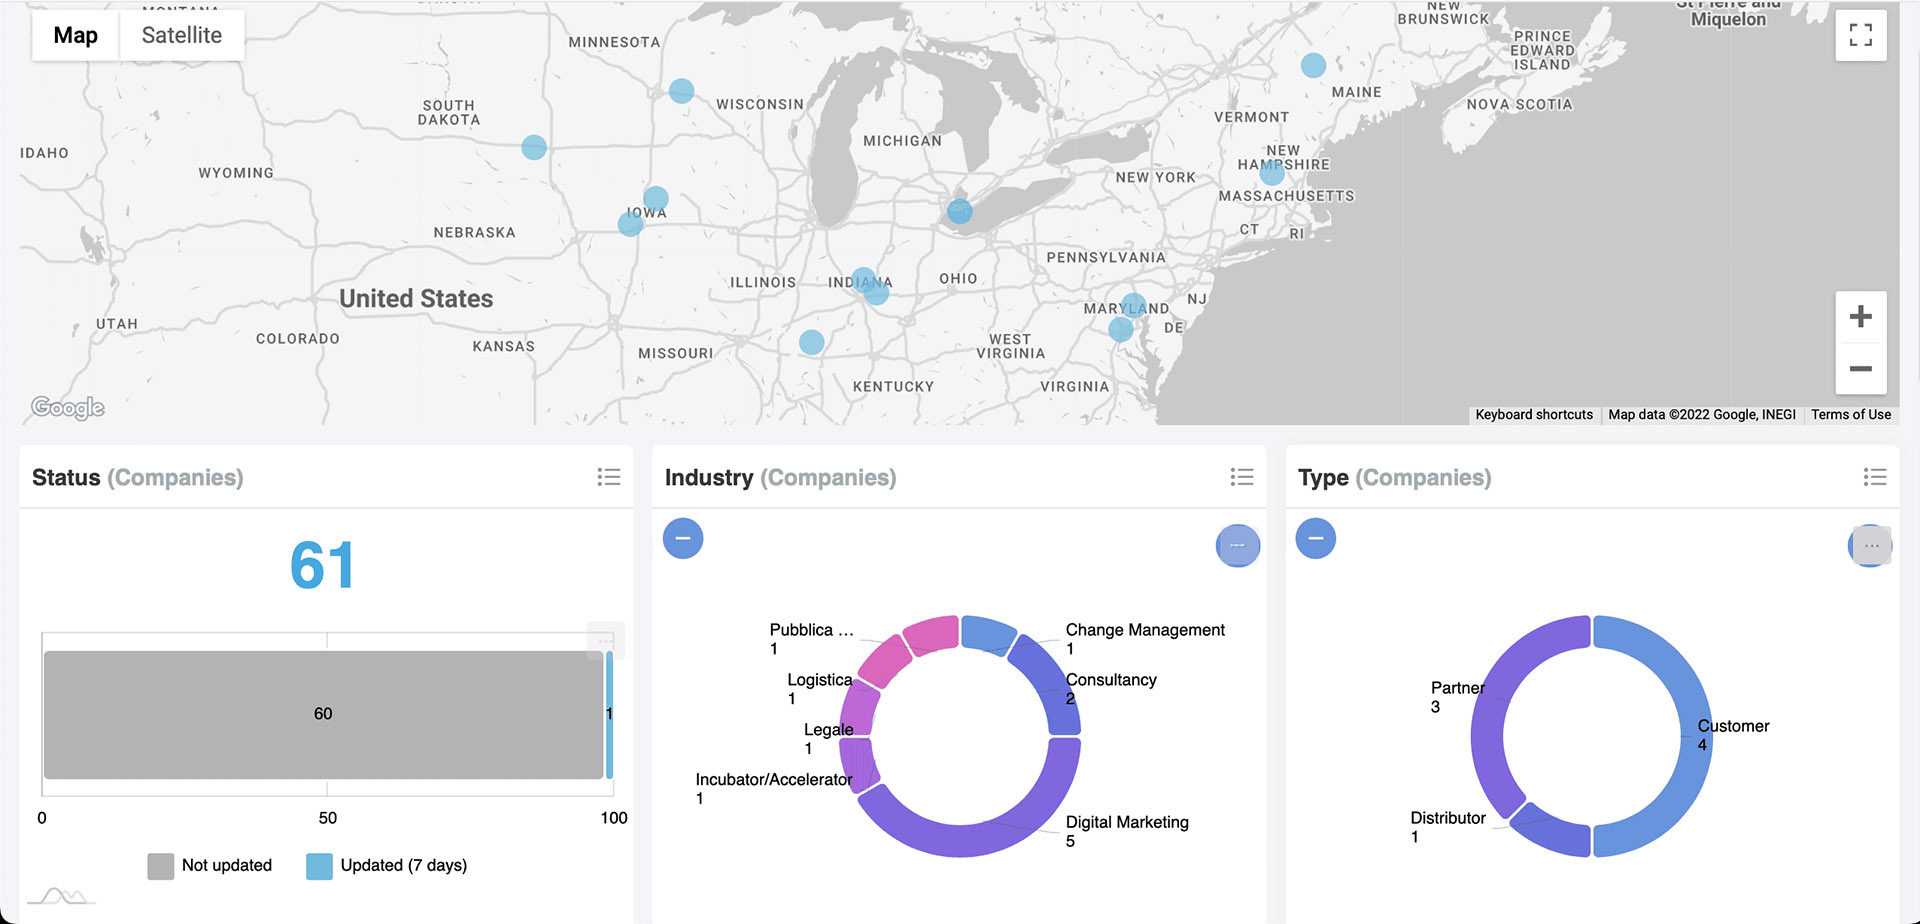
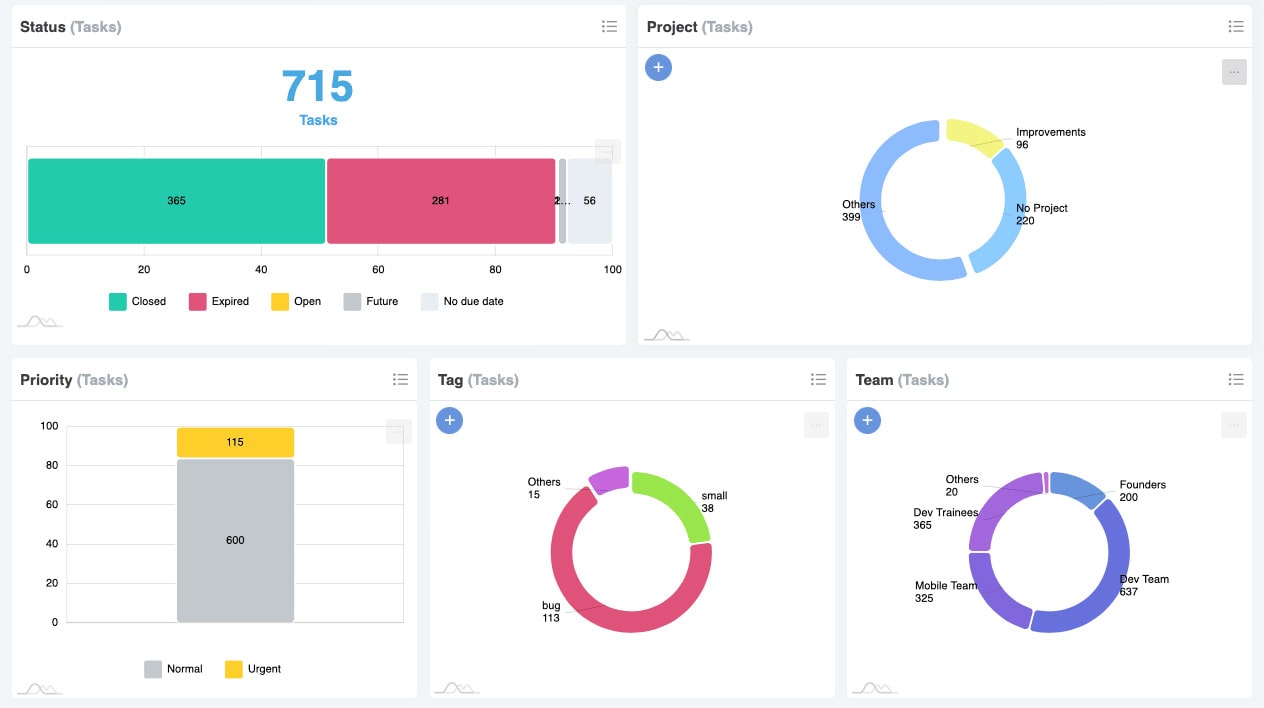
Analyze real_time data, view details, filter according to your needs and download graphs for your presentations.
Interacting with a colored graph is faster than read 10 pages of reports!
